
By Gayle Towell, Timothy O’Neill, Carlos Tafoya, and Nick Fieldhouse (Omron)
This paper presents a comparative study on the performance of Automated Optical Inspection (AOI) systems when applied to printed circuit boards (PCBs) soldered with SAC305 and a third-generation, low-silver, bismuth-containing alloy. We aimed to explore the anecdotal evidence suggesting that the Sn/Ag/Cu/Bi alloy results in fewer false calls compared to SAC305 due to its more uniform matte finish. Although initial findings did not indicate significant differences in false calls, the study revealed that Sn/Ag/Cu/Bi produced more uniform fillets, wetting, and distribution, as well as smoother surfaces, which are critical factors in AOI image processing and analysis. This uniformity enhances the AOI system’s ability to train on images, potentially reducing the complexity of inspection settings.
Introduction
Initial interest in this investigation was prompted by anecdotal reports of electronics assemblers experiencing fewer false positives from AOI equipment upon switching from using SAC305 to using Sn/Ag/Cu/Bi in SMT reflow soldering. Table 1 highlights the differences in composition and properties of these alloys.

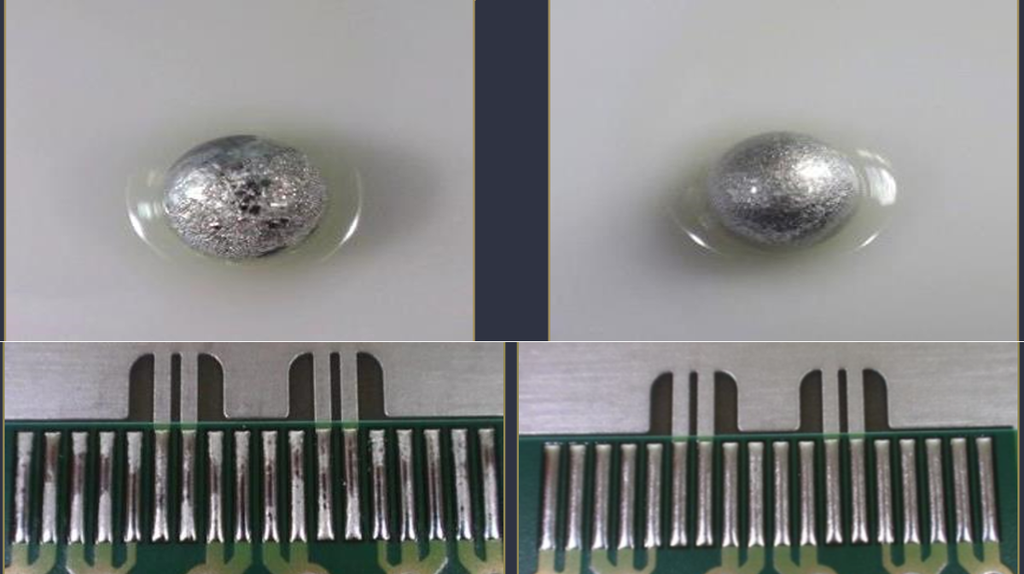
Visual comparison of the two alloys post reflow demonstrates that SAC305 typically displays a nonuniform appearance with some very shiny patches interrupted with various irregularities. In contrast, Sn/Ag/Cu/Bi tends to have a more uniform matte surface, as shown in Figure 1.
It was hypothesized that this difference in surface sheen could result in a difference in false positive AOI readings, since AOI technology relies on the reflection of light off the surfaces of the solder joints. In addition, data previously obtained by a customer evaluating Sn/Ag/Cu/Bi paste against SAC305 and other SAC pastes produced AOI results indicating Sn/Ag/Cu/Bi had the lowest reflection level compared to the other alloys. In this evaluation, having low reflection levels was considered a good result as it reduced the likelihood of false calls during inspection.
A review of the literature thoroughly supports the notion that false calls are a well-known challenge in AOI technology. In a comprehensive dataset collected over 132 days from a Siemens electronics production line in 2023[[i]], a significant number of the boards that were assessed as defective by the machines were determined not defective upon manual inspection. In fact, the ratio of true defects to false calls ranged from 0.003 to 0.028, depending upon AOI inspection type. Each such false call requires manual follow-up, which is time consuming and costly.
Since the development of AOI in solder joint inspection, companies have worked to improve and optimize the technology. This is often tackled by a combination of using more advanced software and AI[[ii]] to analyze the optical data, and by using different lighting techniques to capture the data[[iii]]. Table 2 summarizes some of the different lighting methods used in AOI inspection along with their benefits and drawbacks.
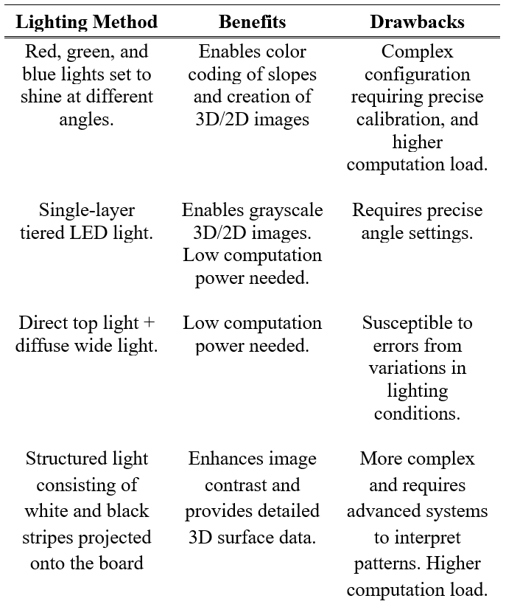
Of note is the fact that the use of multi-angle and multi-color lighting, as seen in 3D AOI systems, including the system used in this study, provides one of the most effective approaches to handling reflective and otherwise challenging surfaces. These methods allow for better differentiation between true defects and reflection-induced anomalies.
Reflection and surface geometry are both well understood as issues to contend with in AOI systems. A paper by Liberty and Skunes[[iv]] details some of the difficulties encountered when inspecting shiny and reflective surfaces specifically, describing in detail how false signals due to reflection of light from one solder joint off of another can cause corruption of solder height values. In that study, the effect was mitigated by the introduction of Multi-Reflection Suppression (MRS) technology, which makes use of multiple camera angles and sophisticated algorithms.
A detailed chapter on Automated Optical Inspection of Soldering by Janóczki et al[[v]] offers insights into how the transition to lead-free solders made AOI more challenging. Whereas tin-lead alloys left a smooth, uniform surface geometry that made automated inspection easier, modern lead-free alloys pose several challenges. Their frequently non-eutectic nature often results in crystallization around cores of differing composition, leading to a rougher surface geometry. Different alloys also have variations in surface finish and reflectivity, which can also affect AOI performance. In this chapter, the measured surface roughness (RMS) of lead-based solder paste is given as 0.03092 compared to SAC-based lead-free paste with a roughness of 0.986, more than three times as much.
The Janóczki et al chapter also offered a comparison of various AOI machines and their capabilities, concluding that machines using multi-angle and multi-color lighting systems were better suited for handling reflective surfaces and complex geometries.
Ultimately, existing literature supports the notion that non-uniform and reflective solder joints may be more challenging for AOI systems and potentially result in more false calls. However, the literature also suggests that more modern technologies – in particular, AOI systems that make use of 3D capabilities, multiple angles and lighting colors, and advanced AI algorithms may be well equipped to mitigate such issues.
Experimental Design
PCB Design and Soldering Process
For this study, two identical test boards were designed to evaluate the performance of SAC305 and Sn/Ag/Cu/Bi solder alloys under identical conditions. The PCBs featured a standard layout, including a mix of surface-mount components, such as resistors, capacitors, and integrated circuits, chosen to represent typical assembly challenges. See Figure 2.
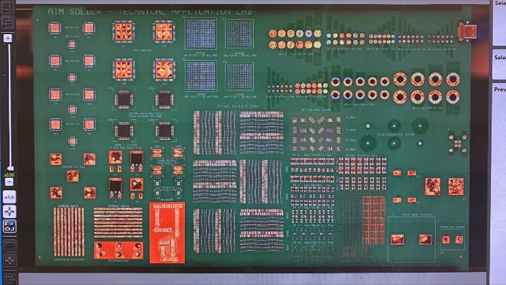
Both boards were printed with the same volume of solder paste using the same stencil and print settings. Print volumes were then verified via SPI and determined to be comparable prior to component placement and reflow.
The soldering process for both boards followed industry-standard reflow profiles optimized for each alloy. The reflow process was carefully controlled to ensure consistency across both boards, minimizing variables that could influence the AOI results.
AOI System and Procedure
The Automated Optical Inspection was conducted using an advanced AOI system provided by OMRON. This system employs a sophisticated multi-angle, multi-color lighting technique, which involves shining lights of different colors at various angles onto the solder joints, as shown in Figure 3.
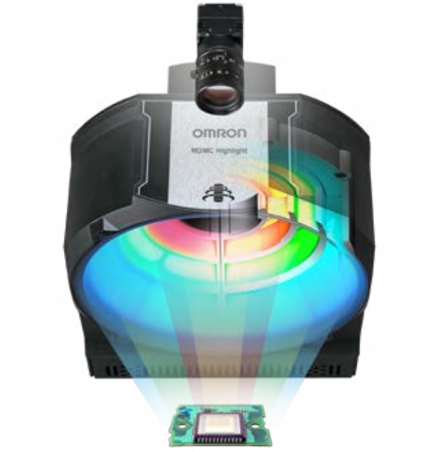
The color of the light reflected back to the system correlates with the angle of the surface at each point. Then, advanced data processing techniques designed to reduce noise from things like shadows and secondary reflections are used to yield a three-dimensional image showing the topography of the solder joints.
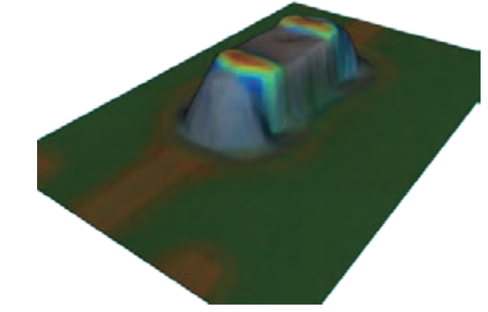
In this study, each board was subjected to a full AOI scan, with particular attention paid to the solder fillets around the surface-mount components. The system’s ability to identify and categorize potential defects was assessed by comparing the AOI data from both the SAC305 and Sn/Ag/Cu/Bi boards.
Results
AOI Inspection Data
While there was not sufficient data to draw any conclusions about false call rates, the AOI inspection did reveal several key differences between the board soldered with SAC305 and the board soldered with Sn/Ag/Cu/Bi. For SAC305, the AOI system detected a higher variability in the slope angles across the solder fillets. These inconsistencies required more detailed adjustments during the AOI system’s training phase, as the system struggled to consistently identify defect-free regions without fine-tuning the settings.
In contrast, the boards soldered with Sn/Ag/Cu/Bi displayed much more uniform slope angles across the solder fillets, as indicated by the consistent coloring in the AOI images shown in Figure 5. This uniformity made it easier to train the AOI system, as selecting a single color or region tended to encompass a larger, more consistent area, reducing the need for multiple calibration points.
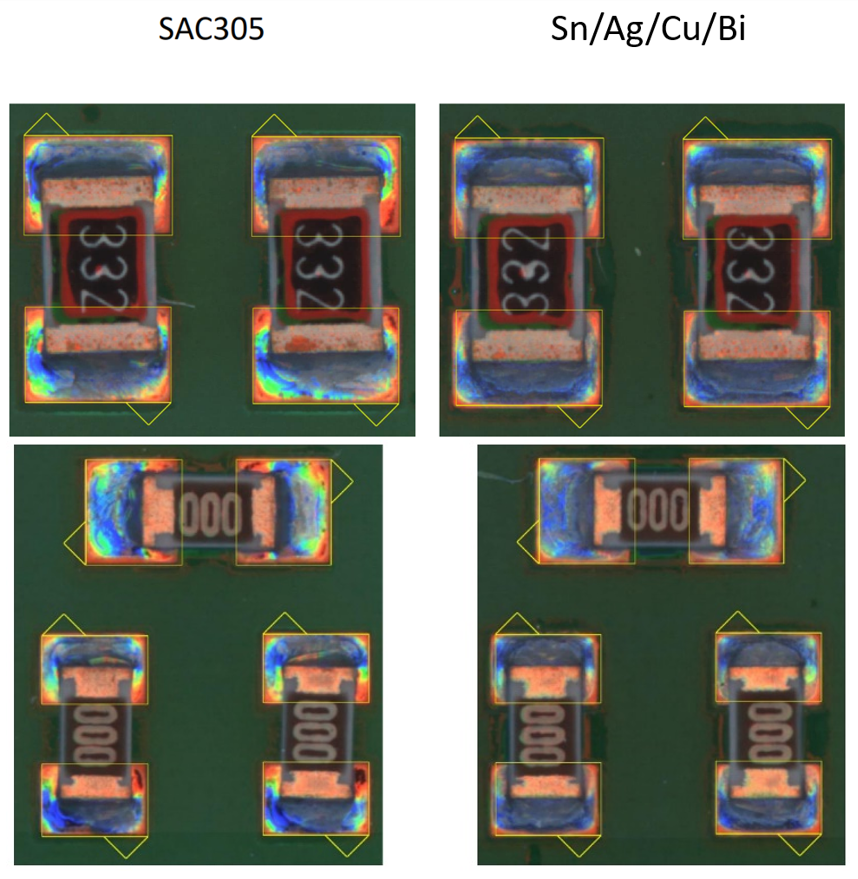
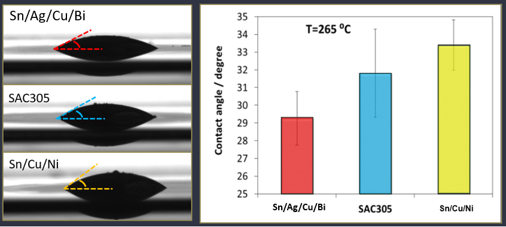
Moreover, this uniformity suggests not just a consistency in sheen, but in surface geometry in general, indicating that Sn/Ag/Cu/Bi may show improved wetting compared to SAC305. This finding is consistent with prior comparisons of wetting angle between the two alloys, in which Sn/Ag/Cu/Bi demonstrated an average wetting angle of 29 degrees compared with 32 degrees for SAC305 in a Sessile Drop Test. See Figure 6.
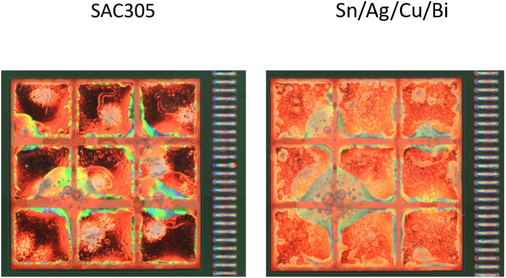
In addition, the images of a windowpane print pattern, typically used for QFNs, show distinct differences between the two alloys, indicating again a more uniform appearance of Sn/Ag/Cu/Bi which also suggests better wetting.
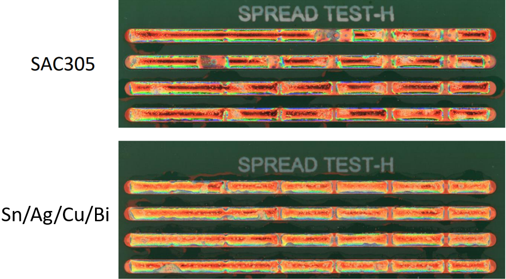
Finally, spread test print patterns for the two alloys indicate more uniform spreading and better wetting with the Sn/Ag/Cu/Bi alloy as shown in Figure 8.
Discussion
The findings from the AOI inspection provide important insights into the influence of solder alloy selection on AOI performance. While the initial hypothesis that Sn/Ag/Cu/Bi would produce fewer false calls was not directly supported by the AOI data, the study did reveal significant advantages in the uniformity of AOI images produced by Sn/Ag/Cu/Bi. The smoother, more consistent slopes observed in Sn/Ag/Cu/Bi solder joints appear to enhance the AOI system’s ability to quickly and accurately assess solder fillets, potentially reducing the time required for system setup and calibration.
One unexpected result was the minimal impact of shininess on the detection of defects in SAC305 solder joints. The multi-angle, multi-color lighting method employed by Omron’s AOI system effectively compensated for the reflective variability, allowing the system to accurately determine the slope of even the shiniest areas. This finding suggests that the AOI system’s advanced imaging techniques are capable of mitigating issues that might otherwise arise from non-uniform reflectivity, although the overall surface variability of SAC305 still posed challenges.
The results indicate that Sn/Ag/Cu/Bi’s uniformity and smoothness could offer practical advantages in manufacturing environments where AOI is heavily relied upon. By providing a more consistent surface for inspection, Sn/Ag/Cu/Bi may reduce the complexity of AOI system configuration, leading to faster inspection times and potentially higher throughput.
Originally published in SMTAI 2024 Proceedings
[[i]] Pfab, K., Eichler, R., Mallandur, A., & Rothering, M. (2024). Data of automated optical inspection of surface-mounted technology electronic production. Data in Brief, 53, 110110. https://doi.org/10.1016/j.dib.2024.110110
[[ii]] Zhang, W., Zhao, Z., Wu, B., Tang, P., Wang, Y., Cole, M., Shen, L. Q., & Vogel, A. (2019). Improve AOI Performance Through Smart Visual Insight Solutions Collaboration. Proceedings of SMTA International, Rosemont, IL, USA.
[[iii]] Abu Ebayyeh, A. R. M., & Mousavi, A. (2020). A Review and Analysis of Automatic Optical Inspection and Quality Monitoring Methods in Electronics Industry. IEEE Access, 8, 183192-183215. https://doi.org/10.1109/ACCESS.2020.3029127
[[iv]] Liberty, T., & Skunes, T. (2015). Addressing High Precision Automated Optical Inspection Challenges with Unique 3D Technology Solution. Proceedings of SMTA International, Rosemont, IL, USA.
[[v]] Janóczki, M., Becker, Á., Jakab, L., Gróf, R., & Takács, T. (2013). Automatic Optical Inspection of Soldering. In Materials Science – Advanced Topics. InTech. http://dx.doi.org/10.5772/51699